A "black" Monday with three answers
On Monday 27 January 2025, word got out that a Chinese company called DeepSeek had trained a competitive language model at a fraction of the computing cost that had been considered necessary. What followed on the American exchanges can be told in three numbers. The Nasdaq Composite closed 3.67 per cent lower. The S&P 500 lost 1.86 per cent. The Dow Jones Industrial Average gained 0.47 per cent.
One piece of news, one trading day, three indices, and one of them up. Nvidia lost 17 per cent on that "black" Monday, wiping out 589 billion dollars of market value, the largest single-day loss any company has ever suffered on an American exchange. The Dow rose all the same, because it weights by share price rather than market value: Nvidia, admitted only in November 2024, carried a fraction of its S&P 500 weight there.
Set the three numbers side by side and the whole mechanism is visible. An index does not mirror the world; it merely holds a weighting. What it tells you about the state of an economy depends on what sits inside it, and on that count nothing material has changed in the eighteen months since that Monday, though a good deal has intensified.
In issue 13 of my newsletter, published on 27 August, I wrote about the article in which five economists at the European Central Bank had put the bubble question to the public ten days earlier. That section drew more replies than anything else in the issue, and they all came down to the same thing: how large is this concentration risk exactly, and what happens if one of the names inside it starts to slide. What follows is my attempt at some answers and calculations on the subject.
What comes next is inference drawn from index weightings, contractual structures and the experience of 2000. It is not a forecast. Perhaps none of the scenarios will materialise. Anyone who has run a trading book knows, however, that the question of probability is rarely the useful one. The useful question is what happens if it does occur, and whether there is still time to react.
The ECB asks questions, but does it offer solutions?
On 17 August 2026, Malin Andersson, Johannes Breckenfelder, Stefano Corradin, Kalin Nikolov and Maria Antonietta Viola published an article for the European Central Bank under the title "The AI boom: rational enthusiasm or the next dot-com bubble?". They do not answer their own question. They state explicitly that today's prices need not represent a ceiling and that valuations could sit considerably higher in future, even after a correction. Nowhere do they call the situation a bubble.
The sentence that matters sits a layer below and was almost universally overlooked in the reporting:
„the case for expecting a correction is not dependent on whether today's prices are rational or irrational"
That settles the debate of the past two years as far as the risk question is concerned. Whether or not the prices are justified changes nothing about the expectation of a correction. The authors ground this in research on earlier technological waves: even if investors are betting entirely rationally on a transformative technology, the option-like character of that bet produces price levels that unwind once the range of possible outcomes narrows. On this reading, Nvidia's twentyfold rise since 2022 is no error but the priced-in value of very large uncertainty. And uncertainty resolves over time, in one direction or the other.
The second sentence that matters concerns Europe:
„Euro area households, which are increasingly channelling funds into low-cost ETFs, have around EUR 440 billion of exposures to US technology equities without necessarily being aware of the associated concentration risk."
Precision is warranted here, because the figure is already being passed along in shortened form. In the body of the text, the 440 billion euros refer to US technology equities as a whole rather than to the seven large names alone, and they come from the ECB's securities holdings statistics with a reference date of the third quarter of 2025. They are therefore almost a year old and, given the inflows into index funds since, are likely to be higher today. Insurers and pension funds also hold substantial positions according to the same article, though the authors give no separate figure for them.
The real contribution of this piece to the debate is a third point, and it is the most uncomfortable. The authors describe how the fund structure itself becomes the transmission channel: a sharp correction forces funds to sell in order to meet redemptions, first the liquid holdings and then the ones that are hard to shift, which pushes valuations down further and triggers the next wave of redemptions. By this route, a private loss turns into a question of financial stability.
The European equity market, by contrast, is dominated by the old economy, shows little of the American enthusiasm and is correspondingly less exposed to a home-grown correction. That offers scant comfort, because the same paragraph carries the qualification that European and American equity markets have historically been very highly correlated. A European index that sat out the exuberance is therefore not protected on the way back down. It simply had less of the ride.
Which raises the question of what is supposed to follow from this analysis. The answer is nothing, at least nothing stated. The article names a risk, measures its size, describes how it travels to Europe, and stops there. It proposes no supervisory measure, recommends neither concentration limits for funds nor disclosure duties towards savers, and it does not tell investors what to do. On the timing of a possible correction the authors expressly decline to comment, since such patterns become identifiable only in hindsight. For an institution that carries responsibility for the macroprudential oversight of the European financial system alongside monetary policy, that is a striking degree of restraint. One may read it as scholarly integrity, and it probably is. Anyone who takes the warning seriously is nonetheless left alone with the consequence.
And then there is the sentence that separates today from 2000:
„unlike in the dot-com episode, today's starting point leaves markedly less room to cut interest rates or use fiscal policy to cushion the fallout."
When the Nasdaq reached its peak on 10 March 2000, the target range of the American central bank stood at 5.75 per cent and rose to 6.5 per cent by May. The American federal budget closed the 2000 fiscal year with a surplus of 236 billion dollars. Neither is available today. The authors put it with the restraint appropriate to a central bank article.
It is worth being precise about what that room for manoeuvre was ever good for. Rate cuts and fiscal programmes softened the recession after 2000, kept companies refinanceable and limited the rise in unemployment. They gave investors nothing back. The Nasdaq Composite lost around 78 per cent by October 2002 and took until April 2015 to regain its earlier level. The S&P 500 lost 49 per cent and needed a good seven years. What a portfolio loses, no central bank recovers, and that was as true in 2000 as it is today. The difference lies one level across: this time the instrument for catching the economy behind it is missing as well.
The greed for quick money
In the spring of 2000 I was chief trader at HypoVereinsbank in Munich. My book was government bonds and interest rate derivatives, in proprietary and client trading alike. Anyone who assumes that such a desk sees little of an equity bubble is badly mistaken. Equity and bond markets always move together. When the technology stocks turned, government bond prices reacted immediately and violently: capital fleeing equities sought the safe haven, yields fell, prices rose. What we traded was the other side of the same panic.
What went on three desks away in technology equities was a different matter entirely. There it was not basis points but multiples of the price-earnings ratio (P/E), and companies whose business model could be told in a single sentence because there was nothing more to tell. And the Neuer Markt was hardly something we read about in the paper. We traders held those shares in our own accounts, myself included, and were hit by the losses like everybody else. You can price risk professionally every day and hold, in your own portfolio, the very bet you would question immediately in a client's. Many of those companies no longer exist.
If you want to know where the danger sat in March 2000, I can tell you. It sat where it sits in every one of these cycles: in the greed for quick money. It is not an elegant insight, and it has the drawback of resisting any model. It has the advantage of having been right every time so far.
What alerted me was neither a price nor a position. It was the conversations. In cafés, over dinner, at the next table, in my own family. My parents talked about shares. Not about investing, not about retirement provision, but about individual stocks and whether you already held this one or that one, the one that had recently doubled, tripled, quadrupled. People who had never discussed securities were suddenly comparing entry prices.
There is an old market adage for this, attributed to Joseph Kennedy, who is said to have got out in time in 1929 after a shoeshine boy offered him stock tips. I put it differently for myself, and without the slightest condescension towards anyone: when people who never deal with capital markets professionally begin talking about individual stocks, demand is no longer backed by analysis but by narrative. That is no judgement on those people. It is a statement about how far a subject has travelled, and therefore about who buys last.
Eight years later I heard the same kind of conversation again, only this time it concerned property and the certainty that house prices always rose. The end of that story is well known.
How broad the market had become back then can be quantified. In 1999 alone, 476 companies listed on American exchanges; across 1999 and 2000 together the figure was 803. For 182 of them the share price doubled on the first day of trading; in the preceding four years that had happened to 34 out of 1,752 flotations. In October 1999, Mary Meeker of Morgan Stanley counted 199 internet stocks with a combined market capitalisation of 450 billion dollars, annual revenue of 21 billion and combined losses of 6.2 billion. By the end of 2004, barely half of those companies were still standing.
And here lies the difference from today, one that has to be acknowledged before it is placed in context. The companies discussed over dinner in 2000 largely earned nothing and half of them disappeared. The seven companies that carry a third of the American equity market today earn a great deal, with net margins above 25 per cent against 13 per cent for the index as a whole. Anyone buying into an index fund today is moreover not buying individual stocks but a broadly spread position, automated, cheap and held over years. That is the more sensible behaviour in every respect, and it would be dishonest to equate the two.
Yet the comparison breaks down somewhere other than one might expect. Whoever bought a technology share in 2000 because it had tripled at least knew they were placing a bet. Whoever sets up a savings plan on a world index today believes they are doing precisely the opposite. The concentration has not disappeared since people stopped talking about individual stocks. It has migrated from the conversations into the product, and there nobody discusses it at all.
How large it is in there can be stated to two decimal places.
A third of the index fits on one line
There is a solid answer to the question of how large the concentration risk is, and it comes not from an analysis but from a file. The two largest providers of index funds on the S&P 500 publish their holdings daily. I pulled both, each as at 26 August 2026, and added up the weightings myself.
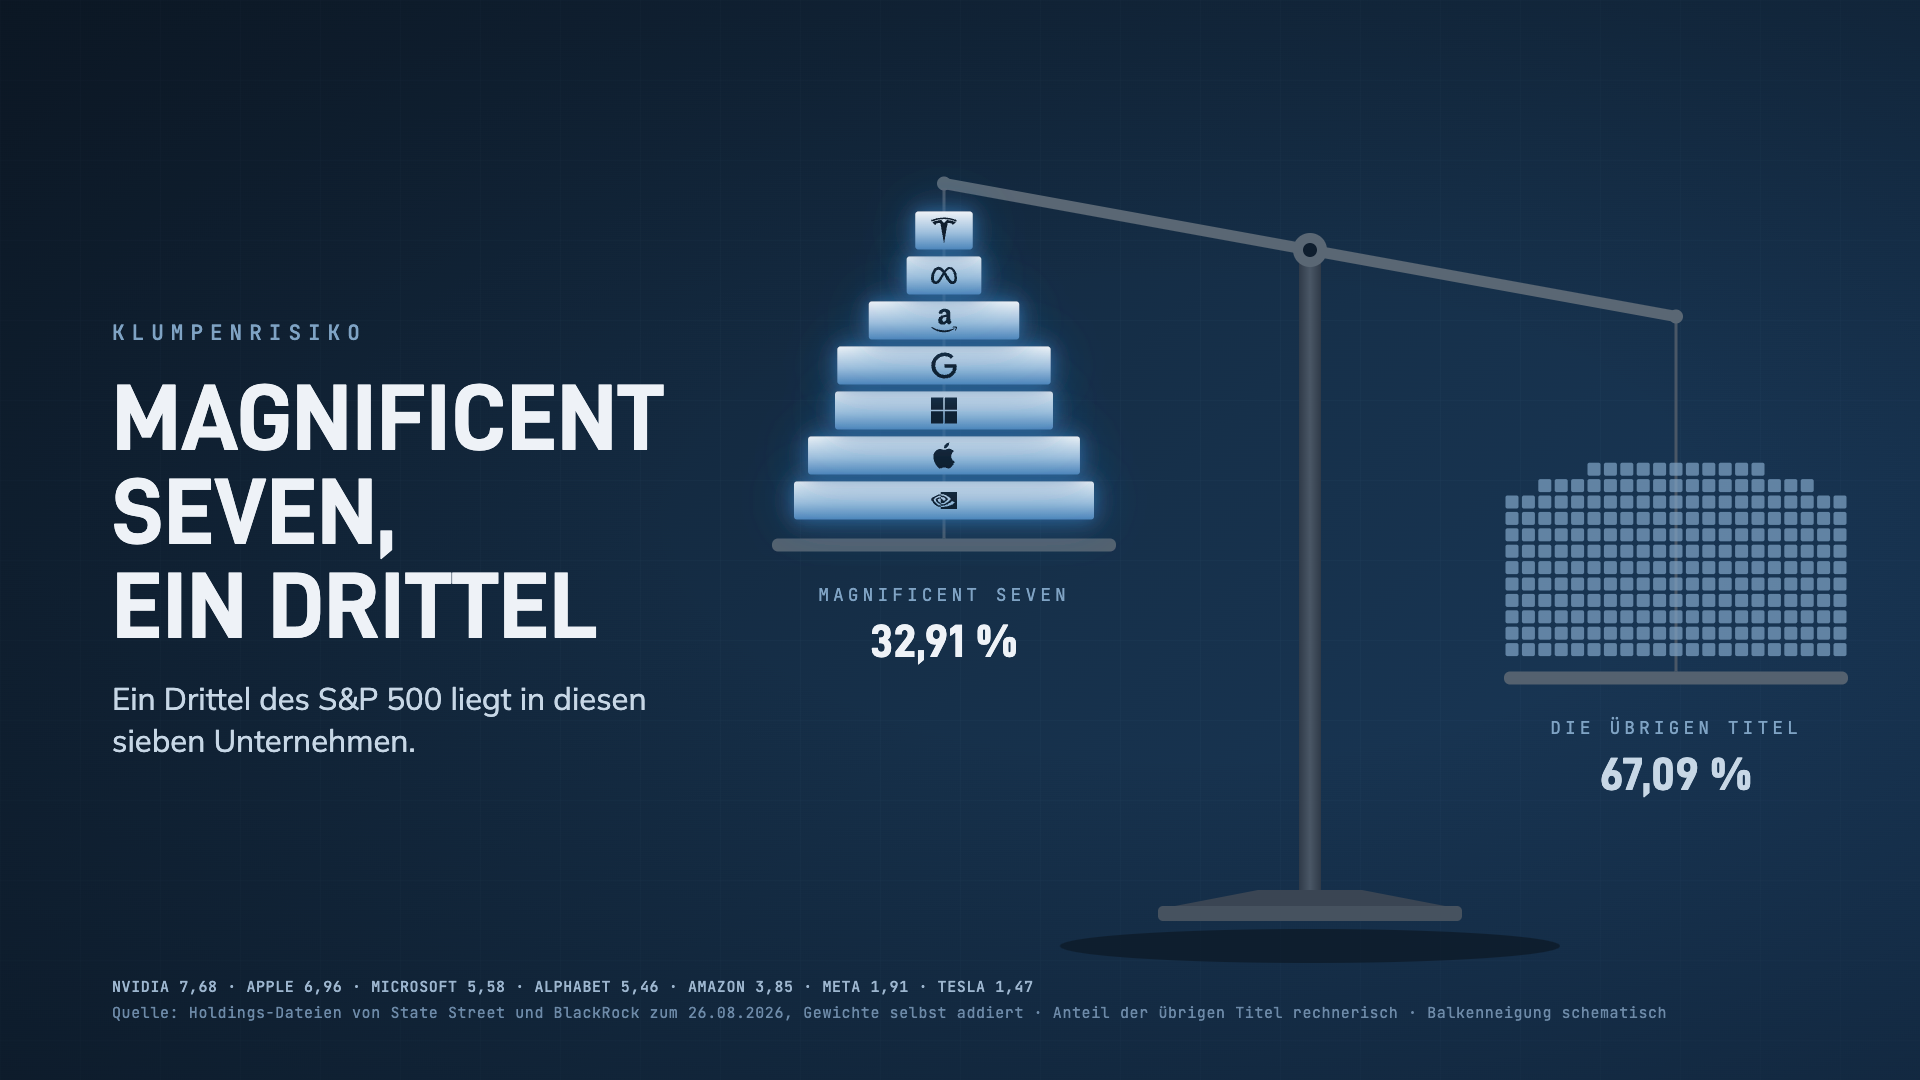
| Company | Index weighting |
|---|---|
| Nvidia | 7.68% |
| Apple | 6.96% |
| Microsoft | 5.58% |
| Alphabet (class A and C) | 5.46% |
| Amazon | 3.85% |
| Meta | 1.91% |
| Tesla | 1.47% |
| Total | 32.91% |
The seven names are not the whole complex, however. Broadcom stands at 2.55 per cent, Micron at 1.60, AMD at 1.19, alongside Palantir, Oracle, Arista, Dell, Vertiv, Constellation Energy and Super Micro. Together these ten suppliers and operators add a further 7.17 per cent. The AI complex within the S&P 500 therefore accounts for 40.08 per cent of the index. Deutsche Bank Research arrives at 40 to 45 per cent for a slightly different grouping and calls it the highest concentration in a single sector since the pre-crash peak of 1929.
This is where the common narrative stops holding. It runs roughly as follows: the dot-com bubble was broad, a field of hundreds of unprofitable firms, whereas today a handful of highly profitable groups carry the market, which makes the situation fundamentally sounder. The first half is correct, as shown above. The conclusion is not. Measured by concentration, the position today is tighter than in 2000, not easier.
| Measure | March 2000 | today |
|---|---|---|
| Top 10 in the S&P 500 | 25.2 to 26.6% | 37.9 to 40.8% |
| Largest 10% of all US stocks | 66.3% | 78.5% |
| Cyclically adjusted P/E (CAPE) | 44.19 (Dec 1999) | 42.27 |
The middle figure deserves a second look. The largest 10 per cent of American stocks now account for 78.5 per cent of total market capitalisation. The previous record dates from June 1932 and stood at 73.8 per cent, measured in the depths of the Great Depression. We have surpassed it.
On the cyclically adjusted P/E, which sets prices against inflation-adjusted average earnings of the past ten years, we stand at 42.27, just below the December 1999 reading. The ECB describes this as „close to their historical peak" and deliberately gives no number. That is the most cautious formulation available for a gap of four per cent to the all-time record.
Now the part that takes the other side seriously, and it is a strong one. Earnings at the seven have grown roughly twenty-threefold since the end of 2015, while those of the rest of the S&P 500 have merely doubled. Six of the seven trade on P/E ratios between 17 and 35 with net margins above 25 per cent. In 2000 the entire sector sat on multiples between 50 and well over 200, with margins near zero or below. At its peak, Cisco cost thirty-nine times its revenue.
„These are real firms with real cash flows, not concept stocks."
Jeremy Siegel, Wharton School, March 2026
The objection holds, and anyone who waves it away is taking the easy route. The concentration of 2000 was not backed by earnings growth; today's is. At the end of 2015, the ten largest companies in the index accounted for 19 per cent of market capitalisation and generated 19 per cent of earnings, a clean parity. Today around 41 per cent of weighting stands against roughly a third of earnings. The gap is real, but it is a gap and not a chasm.
Exactly one value falls outside this range, and it falls a long way outside. Tesla is valued at three hundred and sixty-eight times its earnings, on a net margin of 3.7 per cent. Of the seven names carrying a third of the American equity market, one carries a valuation straight out of the year 2000.
The seller pays the customer who buys from him
An index weighting of 32.91 per cent would be no particular problem in itself if the seven names moved independently of one another. A setback at one would then be a setback at 7.68 per cent of the index, leaving the rest untouched. That independence, unfortunately, does not exist, and the reason for it sits not in the prices but in the contracts.
The underlying pattern is quickly explained. A manufacturer sells goods to a customer who cannot really afford them. To make the purchase happen, the manufacturer provides the money himself, as equity, as credit or as a guarantee towards third parties. The revenue that subsequently appears in the manufacturer's books is impeccable in accounting terms. Economically, however, the money has merely changed hands and returned to its starting point, less a margin that looks on paper like a profit.
Three examples show what this looks like today.
Nvidia and CoreWeave. CoreWeave rents out computing capacity running on Nvidia chips. Following the increase of January 2026, Nvidia holds between ten and thirteen per cent of the company and has additionally undertaken to purchase CoreWeave's unsold capacity itself until 13 April 2032, initially to the value of 6.3 billion dollars. The chipmaker is thus simultaneously a shareholder in its customer, a supplier to its customer, and the buyer of whatever the customer cannot shift.
OpenAI and AMD. In October 2025 the two companies agreed to build out six gigawatts of computing capacity. In return, OpenAI received an option on 160 million AMD shares at an exercise price of one cent, exercisable until 5 October 2030. On full exercise that would amount to roughly ten per cent of AMD. The buyer is therefore paid for his purchase in shares of the seller. Precisely when those shares vest is tied to purchase volumes and share price targets, and those thresholds are redacted in the mandatory filing with the American securities regulator. Anyone wanting to know at what point the customer becomes a co-owner will not find out.
Anthropic and the three large cloud providers. Microsoft, Amazon and Google are simultaneously investors in and suppliers to Anthropic. Microsoft and Nvidia jointly committed fifteen billion dollars in January 2026; in return, Anthropic buys thirty billion dollars of computing capacity from Microsoft. Amazon, alongside a stake, has secured a revenue commitment of more than one hundred billion dollars over ten years.
At this point a figure needs correcting, one that appears in almost every piece written on the subject. Nvidia's much-cited hundred-billion-dollar investment in OpenAI never existed in that form. Nvidia's own interim report to the securities regulator records it as a mere letter of intent and states expressly that there is no assurance of ever reaching a binding agreement. What came of it are two separate constructions: an equity stake of thirty billion dollars from February 2026, carrying no purchase obligation whatsoever, and a guarantee of 105 billion dollars covering lease and power payments for a data centre in Ohio, from August 2026. The second is not an investment but a surety, and it appears on no balance sheet as an asset.
These circles remain harmless only for as long as demand holds. OpenAI itself revised its infrastructure commitments downwards in February 2026, from a reported 1.4 trillion to around 600 billion dollars through 2030. Against that stands revenue running at roughly 24 billion dollars a year as at mid-2026. The commitment therefore exceeds the present business base by something like twenty-fivefold. That can work out if growth holds. It does, however, require growth to hold.
Some readers may recognise a recurring pattern here. In 2000, Lucent Technologies committed 8.1 billion dollars in vendor credit so that network operators could buy Lucent equipment. When the receivables soured, they fed straight through to the profit and loss account, with provisions of 2.2 billion in 2001 and a further 1.3 billion in 2002. The securities regulator sued the company over manipulated revenues of 1.148 billion dollars. Nortel reported a loss of 16.1 billion dollars for 2001, more than the company had earned in its entire history. Lucent was merged with Alcatel in 2006, at a fraction of what it had been worth six years earlier.
The comparison has its limits, admittedly, and they carry weight. Lucent and Nortel financed their customers out of debt, whereas Nvidia, Microsoft and Alphabet operate from current cash inflow and on margins that in Nvidia's case exceed seventy per cent. J.P. Morgan Asset Management sums up the objection thus: today's wave is largely funded from the providers' own free cash flow, revenues arise alongside the build-out rather than after it, and the data centres are not standing empty but running at roughly eighty per cent utilisation, with vacancy at a historic low. Those are three solid arguments, and none of them is a straw man.
Yet the parallel lies not in solvency but in simultaneity. A surety is called precisely at the moment when the guarantor's own business is deteriorating, because the same weaker demand strikes both sides. And the Bank for International Settlements (BIS), which uses the term circular financing in its annual report of June 2026, sets out the chain in sober terms: disappointment in returns could trigger an abrupt withdrawal of financing and turn the capital expenditure boom into a protracted investment bust.
How these constructions are built in detail, and what part take-or-pay contracts, special purpose vehicles and residual value guarantees play in them, I described in a separate article in July. For present purposes the conclusion suffices: the seven names in the index carry one shared bet, listed seven times over.
Three scenarios, honestly calculated
The calculation itself is unremarkable. A capitalisation-weighted index is nothing other than the summed market capitalisation of its members divided by a divisor. If a position with weighting w falls by x per cent and everything else stays put, the index loses exactly w times x. No approximation, no modelling assumption.
The rest is a question of contagion, and that requires assumptions. I set them out openly so that anyone can substitute their own.
| Scenario | Assumption | Effect on the S&P 500 |
|---|---|---|
| 1a | Nvidia falls 50%, nothing else moves | minus 3.84% |
| 1b | Nvidia minus 50%, suppliers minus 25%, rest of index minus 3% | minus 8.19% |
| 2 | All seven minus 30%, rest of index minus 5% | minus 13.23% |
| 3 | The entire AI complex minus 50%, rest of index minus 10% | minus 26.03% |
For context: the S&P 500 lost 49.1 per cent between March 2000 and October 2002, and around 57 per cent between 2007 and 2009. Even the third scenario therefore stays well short of what has actually happened twice in 25 years. Anyone who finds these scenarios dramatic is underestimating what a bear market is.
The first scenario still warrants a second look, because it looks reassuring and unfortunately is not. A 50 per cent collapse in the largest index member costs the index less than four per cent in isolation. That sounds like resilience. On 27 January 2025, however, it was possible to observe what the isolated case looks like once it meets a market: Nvidia's 17 per cent loss should arithmetically have cost the index around 1.3 per cent. It actually lost 1.86 per cent, because it was not only Nvidia that fell but the entire semiconductor sector, by nine to ten per cent. Isolated cases are rare; more often the whole sector moves along.
On top of that comes an amplifier the calculation above does not capture at all, because it sits not in the index mechanics but in the investor structure. The ECB describes it precisely: a sharp correction forces funds to sell in order to meet redemptions, first the liquid holdings and then the ones that are harder to shift, which drives prices lower and triggers the next wave of redemptions. An index fund, after all, need not trade when prices fall, so long as nobody redeems units. It holds the same number of shares, merely at a lower price. Only when investors exit does a paper loss become a sell order, and one that runs across the entire basket, into a falling market.
This is precisely the point at which an American sell-off becomes a European matter, which is why the passage appears in an article by the European Central Bank rather than in an investor magazine.
What this risk costs when somebody has to carry it
The concentration risk is now measured and its effect calculated. What remains is the question of what this risk is actually worth. Not in prices but in capital: what would somebody have to hold who carried the same position and had to answer for it under supervisory rules?
The question can be answered, because there are calibrated frameworks for it. They are addressed to regulated institutions rather than to private investors, however, and that is precisely where the insight lies.
The closest yardstick is the equity sub-module of Solvency II, the European supervisory regime for insurers. Listed equities from the European Economic Area and the OECD, designated type 1 equities in the framework, carry a standard stress of 39 per cent. That figure is modulated by the symmetric adjustment, a mechanism that shifts the requirement according to market conditions within a corridor of currently plus or minus 10%, rising to plus or minus 13% from 30 January 2027. The effective range today therefore runs from 29 to 49 per cent.
Applying that yardstick to the 440 billion euros that European households hold in American technology equities according to the ECB produces the following:
| Approach | Capital requirement |
|---|---|
| Standard stress 39% | EUR 171.6bn |
| Lower bound, 29% | EUR 127.6bn |
| Upper bound, 49% | EUR 215.6bn |
This calculation is expressly a thought experiment and describes no applicable requirement. Solvency II governs insurers, not households, and nobody asks a saver to hold capital. The comparison does, however, reveal an order of magnitude that otherwise stays invisible: were the same position held in an insurance portfolio, a three-digit billion sum in own funds would have to be set against it. In private portfolios it sits with no backing at all.
That describes no regulatory gap. It is the difference between a balance sheet that endangers third parties under stress and a portfolio in which the owner bears his loss alone. The remit of supervisory law ends with the system; it was never written for the return on a portfolio. Understanding that distinction also explains why a central bank warning cannot be an instruction to savers.
That leaves the second question: does the framework set limits on concentration within the fund itself? The European fund directive, known by its English acronym UCITS, requires diversification in principle under Art. 52. No more than five per cent of assets may be exposed to a single issuer, a member state may raise this to ten per cent, provided all positions above five per cent together do not exceed forty per cent. Fund practitioners know this as the 5/10/40 rule.
Under that rule, a fund tracking the S&P 500 would not be permissible. For Art. 53 raises the limit for index-tracking funds to twenty per cent per issuer, and under exceptional market conditions with dominant individual stocks as far as thirty-five per cent. Nvidia sits well below that at 7.68 per cent.
This is neither an oversight nor a loophole but a deliberate exemption, codified since 2009. Anyone seeking to track an index must be allowed to track it, or the product would be pointless. The consequence is nonetheless worth naming: the diversification rule meant to keep European funds safe for private investors is suspended for precisely the product category in which European private investors now hold the greater part of their equity wealth.
An MSCI World ETF is 72% America
So far the subject has been an American index. Most European savers would say they are not invested in it at all. They pay into a world index, because it counts as the broadest product available, and many chose it expressly to escape the American concentration risk.
The most widely used of these indices is the MSCI World. Its share of American stocks stood at 72.03 per cent as at 31 July 2026. Japan follows on 5.73 per cent, the United Kingdom on 3.61, Canada on 3.41 and France on 2.44. The entire rest of the world shares 12.78 per cent.
What that means for the seven names can be established two ways, and both are instructive. MSCI itself last put the share of the "Magnificent Seven" in the world index at around 22 per cent in June 2025, up from 18 per cent at the end of 2023. Since that figure is now more than a year old, I additionally pulled the holdings list of a fund tracking the MSCI World and added up the weightings myself. As at 13 August 2026 the seven come to 23.21 per cent there, spread across an index of 1,306 positions. Concentration has therefore risen by a good percentage point since the MSCI publication rather than fallen.
Add Broadcom, Micron and AMD, as done above for the American index, and the figure is 27.23 per cent. Of every hundred euros paid into a world ETF, then, around 23 go to seven companies and a good 27 to the AI complex as a whole. The largest European entry on that list is ASML at 0.77 per cent.
None of this is a criticism of the product. A world index reflects the world as capital markets weight it, and capital markets currently weight America that way. It is a statement about what the word "world" promises on the packaging and what is actually inside.
The scale of this channel shows in the savings plans. Across Germany and continental Europe, 15.1 million ETF savings plan executions ran each month in 2025, up almost forty per cent on the previous year. Around 34 billion euros are expected to be invested through this route alone in 2026. German investors held ETFs worth 590 billion euros at the turn of the year. MSCI World and S&P 500 are by some margin the most popular underlyings.
One detail of the mechanics matters here, because it is frequently misunderstood. A capitalisation-weighted index fund need not sell when prices fall. It holds the same number of shares in each position; as one position falls in value, its weighting falls of its own accord and the others rise correspondingly. The index rebalances itself without a single order being required. Trading occurs only at the scheduled index review, on corporate actions, and when investors subscribe or redeem units.
That last case is the critical one, and it was described above: when investors sell, the fund must sell across the entire basket, regardless of which position triggered the fall. A withdrawal from a world ETF then hits the Japanese, British and French holdings within it, which had nothing to do with the matter.
The Nasdaq-100 has demonstrated that a concentration limit can also bite in the other direction. Its rulebook requires a special rebalancing as soon as all members with an individual weighting of at least 4.5 per cent together exceed 48 per cent of the index. In July 2023 that point was reached. Effective 24 July the weightings were reset: Microsoft fell from 12.67 to 9.84 per cent, Nvidia from 6.97 to 4.23. It was only the third special rebalancing in the history of the index, after 1998 and 2011.
What is striking is the direction. The intervention was triggered not by falling prices but by rising ones. The funds tracking the index had to sell into a still-rising market, and precisely the stocks that had performed best. A concentration rule therefore costs money even when everything goes well. That is the price of it working in the opposite case, and it is why such rules are so rare.
The S&P 500, incidentally, has no such trigger.
What follows from this
A disclaimer and a delimitation first, regrettably necessary these days: nothing that follows is investment advice. Whether somebody should hold, buy or sell equities depends on their circumstances, not on an index weighting, and no comment piece can answer that. What a comment piece can do is describe what is measurable, so that everybody makes their own decision on a better footing.
To calculate the actual weighting of the seven names in your own portfolio rather than estimate it. The holdings lists of all the large index funds are public and updated daily; the calculation set out above took under ten minutes and requires nothing beyond a spreadsheet.
To check the overlap between your own products. Anyone paying into an S&P 500, an MSCI World and a technology fund side by side holds the same seven companies three times over, and the diversification between those products is considerably lower than their names suggest.
To calibrate your expectations about the time horizon. After March 2000, Cisco took twenty-five years to regain its peak price and Intel almost twenty-six, and both companies came through that period successfully. Anyone assuming a ten-year investment horizon should know that the recovery of a single stock can take longer than the horizon itself.
To determine your own position in the chain. Equity risk in the trading book is the obvious part and rarely the largest. The less visible part sits in unit-linked policies, in commitments to pension schemes, in credit lines to addresses in the AI sphere, and in securitisations whose collateral ages faster than their term.
To measure concentration risk across products rather than per product. A fund that complies with Art. 53 UCITS is compliant. A portfolio of fifteen compliant funds can nonetheless carry a concentration risk that none of the fifteen shows on its own. Look-through at individual stock level is the only way to see it.
To run the scenarios described above through your own portfolio as an exercise, with your own contagion assumptions. The purpose is not the forecast but the question of which decision falls due at which index level, and who takes it.
Not to assert diversification as a product characteristic without having calculated it. "Globally diversified" is, at 72 per cent America and 23 per cent in seven companies, a statement that requires explanation, and before the client signs rather than after.
To set out the concentration profile in the advisory documentation. It is publicly available, it changes slowly, and it is the one figure that will be asked about in the event of a claim.
For all three groups the same sentence applies: concentration is a measured state, present regardless of whether a correction arrives or not. Knowing it means no decision has yet been taken. Not knowing it means one already has.
Twenty-five years is a long holding period
On 27 March 2000, Cisco Systems became the most valuable listed company in the world at 555 billion dollars, displacing Microsoft from first place. The share stood at 80.06 dollars. It then lost around eighty per cent.
What is remarkable about that lies not in the loss figure but beside it: Cisco's revenue never collapsed. It stood at 19 billion dollars in the 2000 financial year, rose to 22 billion in 2001 and fell back to 19 billion in 2002. The company went on building the equipment the internet ran on, remained the market leader and earned money. What collapsed was solely the price people were willing to pay for those earnings.
Cisco regained its March 2000 high on 10 December 2025, twenty-five years, eight months and thirteen days later. Intel took longer still. The chipmaker surpassed its high from the year 2000 only on 22 June 2026, carried, of all things, by its artificial intelligence business. The company that a technological wave had nearly finished off was set back on its feet by the next one.
Anyone invested in both in March 2000 had therefore not been wrong about the companies. They had been wrong about the price, and that cost a quarter of a century.
„A US AI fallout would not remain a US problem."
European Central Bank, 17 August 2026
Which brings us back to that Monday in January 2025, when a report out of China sent three indices in three different directions. The Dow Jones did not rise that day because its investors were wiser. It rose because it weights the affected share by its price, not by its market value. And that is the explanation.
An index does not take the decision away from you, it merely conceals it. Anyone holding 32.91 per cent of their American equity wealth in seven companies, and 23.21 per cent of their world portfolio in those same seven, has taken that decision. Most, however, have taken it without noticing.
Whether the valuations are justified I cannot say. And I doubt anyone can foresee it either. The ECB states expressly that it does not matter for the risk question. What I took away from the spring of 2000 is something else, and less elegant: the danger sat not in the prices but in the readiness to mistake a narrative for a calculation or a forecast. That readiness has not disappeared. It has merely found another product, one that has the added advantage of looking sensible.
The end of this story will be decided not by whether the correction comes. It will be decided by who did the arithmetic beforehand and hedged accordingly.

Christian Schablitzki
Strategy & Management Consultant · Agentic AI expert for financial institutions
More than 20 years in investment banking and derivatives trading, followed by over 10 years advising financial institutions. Currently Partner at Infosys Consulting in Germany. Certified in Google AI, Generative AI Leader (Google Cloud) and IBM RAG and Agentic AI.
LinkedIn profile →Keep reading – every 14 days in your inbox.
Capital markets insights, regulatory updates and AI trends. Concise, well-founded, free.
GDPR-compliant. Unsubscribe at any time.